파이썬/그래프 그리기
python(vscode)/다중축 그래프에 마우스 데이터
gongdol
2024. 1. 24. 23:06
300x250
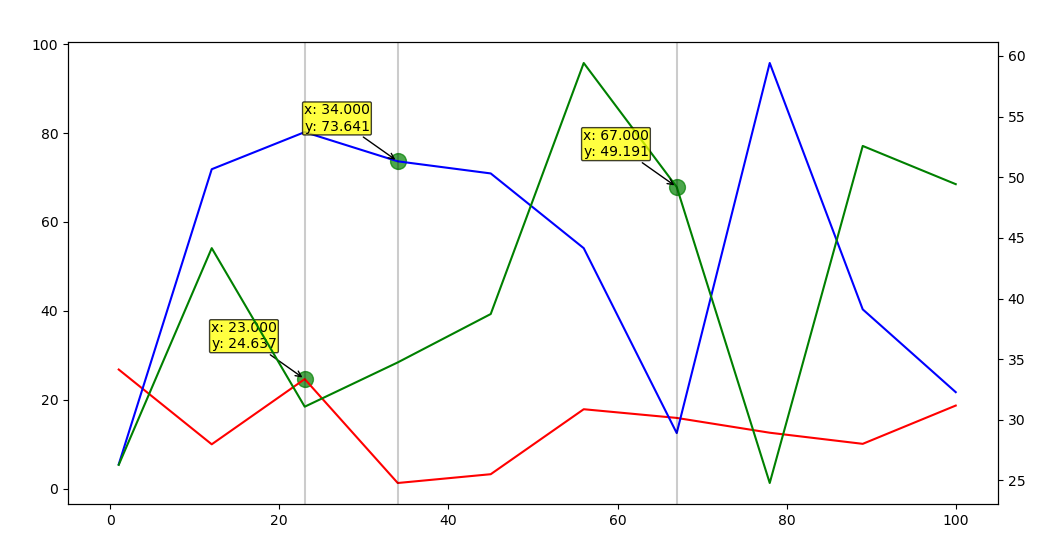
1. 코드 작성
|
1
2
3
4
5
6
7
8
9
10
11
12
13
14
15
16
17
18
19
20
21
22
23
24
25
26
27
28
29
30
31
32
33
34
35
36
37
38
39
40
41
42
43
44
45
46
47
48
49
50
51
52
53
54
55
56
57
58
59
60
61
62
63
64
65
66
67
68
69
70
71
72
73
74
75
76
77
78
79
80
81
82
83
84
85
86
87
88
89
90
91
92
93
94
95
96
97
98
99
100
101
102
103
104
105
|
import numpy as np
import matplotlib.pyplot as plt
import matplotlib.cm as cm
import scipy.spatial as spatial
def fmt(x, y):
return 'x: {x:0.3f}\ny: {y:0.3f}'.format(x=x, y=y)
class FollowDotCursor(object):
"""Display the x,y location of the nearest data point.
https://stackoverflow.com/a/4674445/190597 (Joe Kington)
https://stackoverflow.com/a/20637433/190597 (unutbu)
"""
def __init__(self, ax, x, y, formatter=fmt, offsets=(-20, 20)):
try:
x = np.asarray(x, dtype='float')
except (TypeError, ValueError):
x = np.asarray(mdates.date2num(x), dtype='float')
y = np.asarray(y, dtype='float')
mask = ~(np.isnan(x) | np.isnan(y))
x = x[mask]
y = y[mask]
self._points = np.column_stack((x, y))
self.offsets = offsets
y = y[np.abs(y - y.mean()) <= 3 * y.std()]
self.scale = x.ptp()
self.scale = y.ptp() / self.scale if self.scale else 1
self.tree = spatial.cKDTree(self.scaled(self._points))
self.formatter = formatter
self.ax = ax
self.ly = self.ax.axvline(color='k', alpha=0.2)
self.fig = ax.figure
self.ax.xaxis.set_label_position('top')
self.dot = ax.scatter(
[x.min()], [y.min()], s=130, color='green', alpha=0.7)
self.annotation = self.setup_annotation()
plt.connect('motion_notify_event', self)
def scaled(self, points):
points = np.asarray(points)
return points * (self.scale, 1)
def __call__(self, event):
ax = self.ax
# event.inaxes is always the current axis. If you use twinx, ax could be
# a different axis.
if event.inaxes == ax:
x, y = event.xdata, event.ydata
elif event.inaxes is None:
return
else:
inv = ax.transData.inverted()
x, y = inv.transform([(event.x, event.y)]).ravel()
annotation = self.annotation
x, y = self.snap(x, y)
self.ly.set_xdata(x)
annotation.xy = x, y
annotation.set_text(self.formatter(x, y))
self.dot.set_offsets((x, y))
event.canvas.draw()
def setup_annotation(self):
"""Draw and hide the annotation box."""
annotation = self.ax.annotate(
'', xy=(0, 0), ha = 'right',
xytext = self.offsets, textcoords = 'offset points', va = 'bottom',
bbox = dict(
boxstyle='round,pad=0.1', fc='yellow', alpha=0.75),
arrowprops = dict(
arrowstyle='->', connectionstyle='arc3,rad=0'))
return annotation
def snap(self, x, y):
"""Return the value in self.tree closest to x, y."""
dist, idx = self.tree.query(self.scaled((x, y)), k=1, p=1)
try:
return self._points[idx]
except IndexError:
# IndexError: index out of bounds
return self._points[0]
np.random.seed(6)
numdata = 10
t = np.linspace(1, 100, numdata)
y1 = np.random.random(numdata)*30
y2 = np.random.random(numdata)*60
y3 = np.random.random(numdata)*100
fig = plt.figure(figsize=(12,6))
ax1 = fig.add_subplot(111)
ax1.plot(t, y1, 'r-', label='y1')
ax1.plot(t, y3, 'b-', label='y3')
ax2 = ax1.twinx()
ax2.plot(t, y2, 'g-', label='y2')
cursor1 = FollowDotCursor(ax1, t, y1)
cursor3 = FollowDotCursor(ax1, t, y3)
cursor2 = FollowDotCursor(ax2, t, y2)
plt.show()
|
cs |
2. 결과
https://www.geeksforgeeks.org/use-different-y-axes-on-the-left-and-right-of-a-matplotlib-plot/
https://zephyrus1111.tistory.com/133
https://stackoverflow.com/questions/21583965/matplotlib-cursor-value-with-two-axes
300x250